


Your Dashboards Are Green, But Users Can’t Use Your Service
Digital experience monitoring reveals what internal tools miss — why users fail at login or checkout even when dashboards look healthy.

Your tools say things look normal. Services show healthy. Errors look steady.
But users are complaining. Some cannot log in. Others see pages stall or time out. In telecom, calls may drop or video can freeze. In healthcare, a patient portal may hang at the worst moment. In energy, a field team may lose access to a system they rely on. Support tickets pile up, and leadership asks the same question: “Is something down?”
You check again. Internally, it still looks fine.
This is one of the most frustrating moments in operations because you are being asked to fix what you cannot see.
In other words, when dashboards are green, but users are complaining is the moment you realize you’re missing part of the picture.
Green Dashboards, Broken Journeys
When users can't complete critical tasks, but your tools say everything as fine
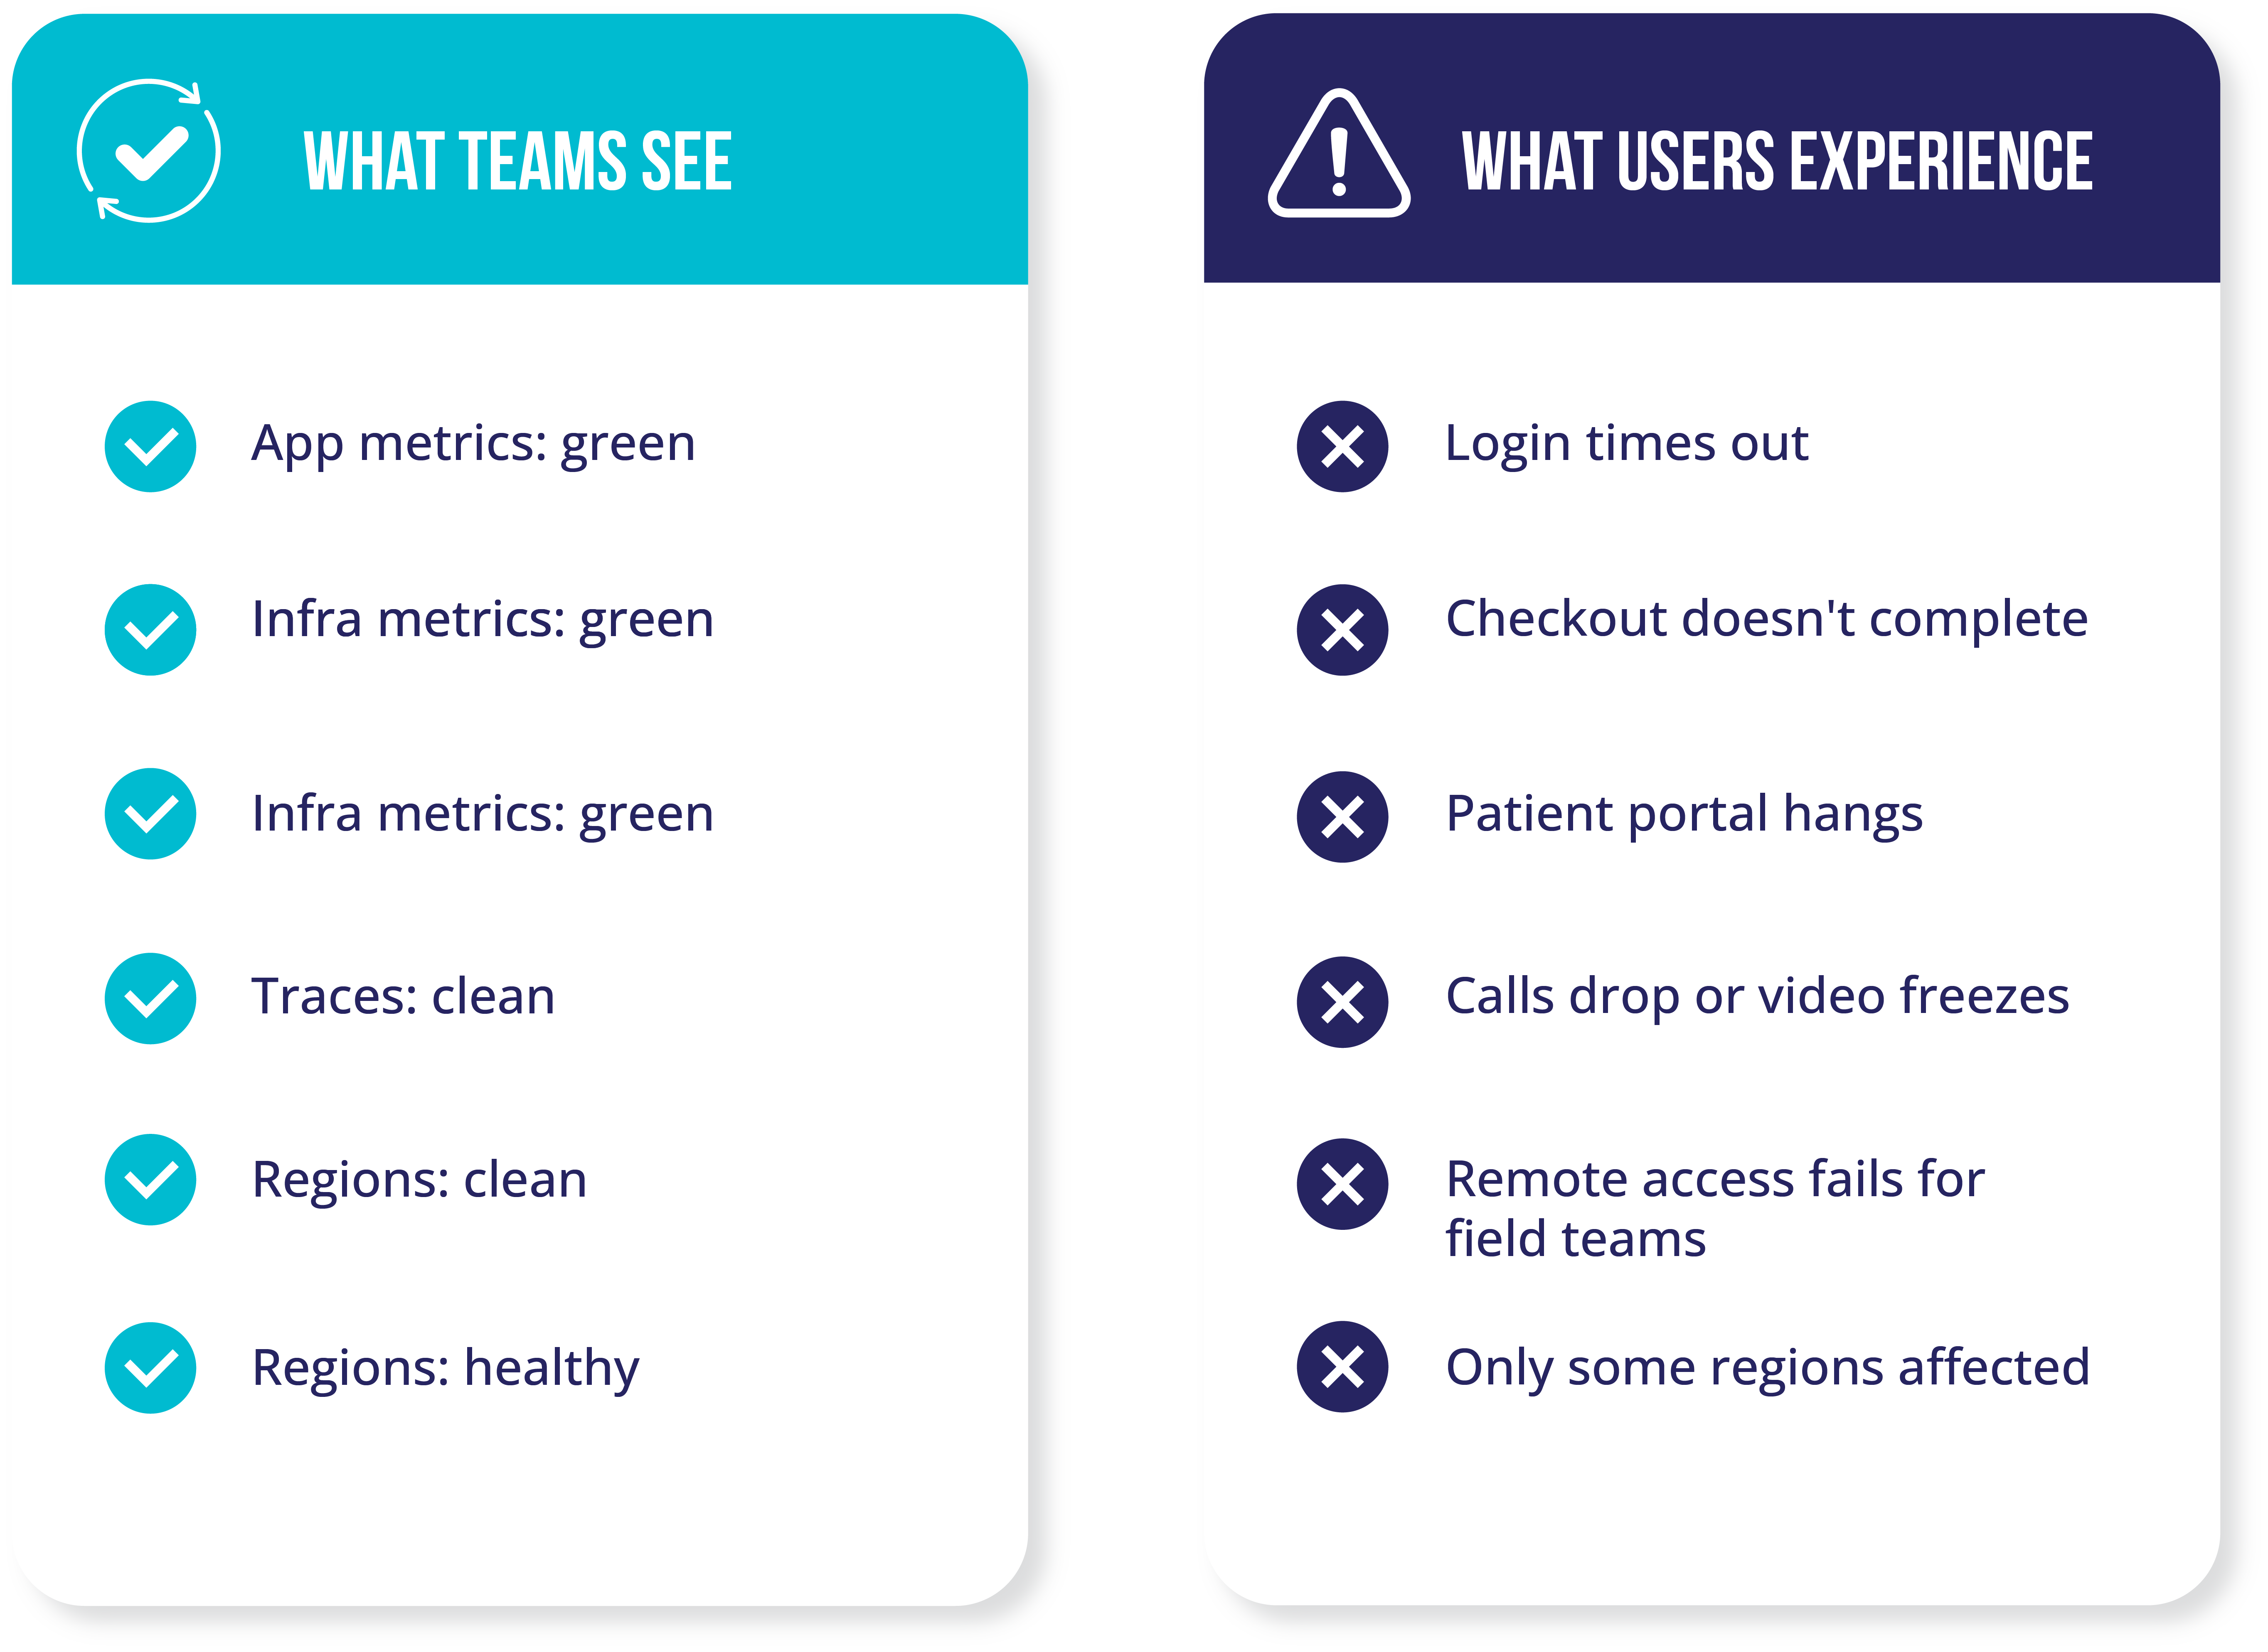

Everything looks healthy, except the user experience.
When your tools say everything’s fine, but customers can’t use your service
Most teams picture a clean path from a user to an application. In reality, every request travels through networks and systems you do not control.
A user’s request may pass through:
- their ISP
- carrier networks and peering points
- DNS lookups that decide where the request goes
- a CDN edge location
- cloud backbones
- third-party services like payments, identity, tax, messaging, or analytics
If any part of that path is slow or unstable, your customer experience breaks. Your internal dashboards can still look fine.
That is why the pattern shows up as dashboards are green but users are complaining. Your tools are measuring what they were designed to measure. They just cannot see the whole journey.
The hidden internet path problem
This is not about “bad tools.” Most monitoring and observability platforms are strong at what they were built for: understanding what you own and operate.
The limitation is the scope. Traditional tools typically cannot answer questions like:
- Which carrier hop is dropping packets?
- Which region or ISP is affected?
- Did routing change for a subset of users?
- Is a CDN edge or DNS resolver adding delay?
- Which upstream dependency is slowing authentication or checkout?
So when something breaks on the public internet or inside a third-party dependency, it shows up to customers as your outage. Your team gets pulled into a war room, and you start guessing.
Outages that look like your fault, but are not
Here are examples that match the “everything looks fine” pattern.
Fintech and payments
Transfers slow down during peak hours. Internal systems look healthy. The real issue is packet loss on an upstream carrier hop. Users feel it as “the app is broken.”
Retail and e-commerce
Checkout fails for one country or one ISP group. Cloud tests pass. A peering point is congested, so some users take a worse route than others.
SaaS and identity
Logins fail intermittently. Tokens are valid. The identity provider reports healthy. A subset of users is being routed through a problematic edge path.
This pattern is not limited to a few sectors. It appears in any industry that depends on the internet to complete critical tasks, not just to host a website.
When the internet is part of how work gets done, how care is delivered, how revenue flows, or how teams stay connected, small issues outside your environment can quietly break the experience.
Those examples tend to get the most attention because they are customer-facing.
But the same pattern shows up well beyond digital commerce and payments.
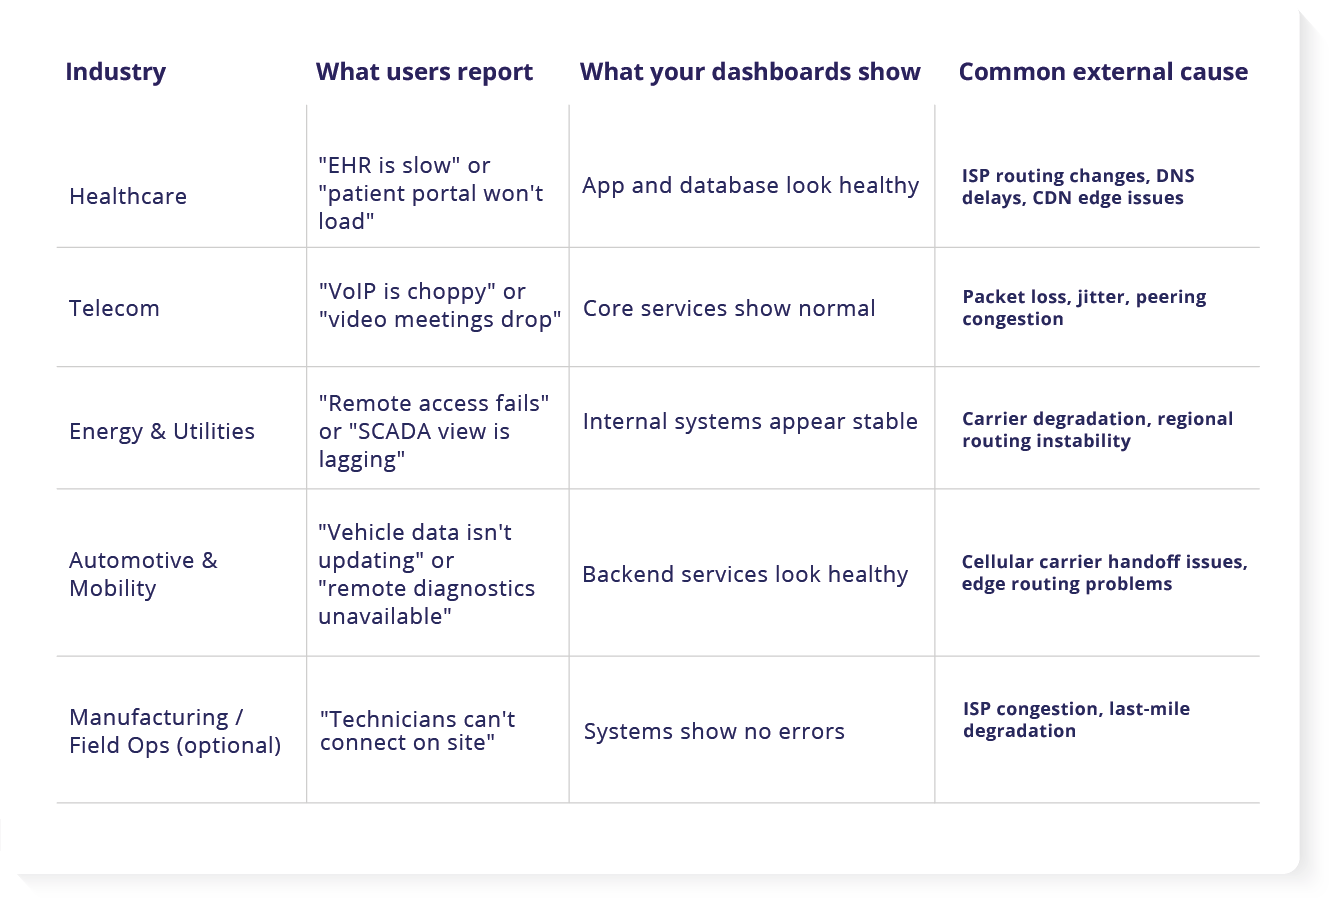
Industry examples: symptoms of external internet path issues
The cost is not just the outage, it is the chase. The most expensive part is often the time spent proving what is happening.
Teams restart services, roll back releases, scale infrastructure, or fail over regions. Those actions can be reasonable when you truly have an internal issue. They are wasted when the real cause is outside your boundary.
Meanwhile:
- customers abandon tasks
- support volume grows
- leaders lose confidence
- engineers lose hours in war rooms
Even when the issue is external, customers still experience it as your problem.
How internet path visibility changes the workflow
The goal is not to blame the internet. The goal is to see what your customers are experiencing, then act with confidence.
This is where internet path visibility and external dependency monitoring matter.
Instead of guessing, you can answer:
- Is this internal or external?
- Where does packet loss or latency start?
- Which users are affected, and where?
- Which vendor or carrier should be escalated?
- What is the impact on critical services?
This is how you shorten incidents. You reduce the time to find the cause, and you stop wasting time on fixes that cannot work.
How WanAware connects the outside to the inside
WanAware pairs two ideas that work best together.
External Infrastructure Graph
This is the external view. It maps the internet path users take, including carriers, routing shifts, DNS behavior, and edge locations. It helps you pinpoint where performance starts to degrade.
Relationship Graph
This is the context view. It ties an external problem back to what it impacts inside your environment. Which service is affected, which user journey is impacted, and what the blast radius looks like.
Together, they help teams move from “users are angry but dashboards are green” to “this carrier hop is dropping traffic for this region, impacting login and checkout.”
That is the difference between a long war room and a fast, focused response.
Customers feel stability again, because you can fix the right thing faster
Seeing the cause is not the same as fixing the internet. But visibility changes what you can do next.
When you can prove the issue is in a specific path or provider, teams can often:
- escalate to the right vendor with evidence
- work with CDN or carrier support faster
- adjust routing policies where possible
- shift traffic to healthier paths or regions
- communicate clearly to customers and leaders
Even when the fastest “fix” is escalation, the customer impact improves because you reduce time spent guessing and you start acting on the real cause sooner.
What to do next
Most teams start with one high-value user journey, one region, or one recurring mystery incident.
A user journey is simply a key path someone needs to complete, like “log in,” “load a patient chart,” “place a call,” or “open the SCADA view.”
When we say visibility compounds, we mean this: once you can see the full path, every incident teaches you something you can use next time. Patterns become familiar. Triage gets faster. Escalation gets cleaner. Over time, the same issues stop turning into full war rooms.
That is exactly what teams need when dashboards are green, users are complaining.
FAQs
What industries does this affect?
Any industry where critical work depends on the public internet, not just internal networks. It is common in e-commerce, fintech, and SaaS because users feel issues immediately during login, checkout, or payments. It also affects healthcare, telecom, and energy and utilities, especially when patient portals, voice and video, SCADA visibility, or remote access must work across regions, ISPs, and third-party services.
How do ISP and carrier problems show up in healthcare, telecom, and energy?
Healthcare: Patients and clinicians report slowness or timeouts in portals and EHR access, often tied to regional ISP routes, DNS delays, or congested paths that your internal dashboards do not measure.
Telecom: Voice and video issues show up as jitter, dropped calls, and choppy audio, especially when traffic crosses congested peering points or a carrier hop starts dropping packets.
Energy and utilities: Remote access, monitoring, and field connectivity can become slow or unreliable when carrier routes degrade between sites, regions, or third-party providers, even when core systems look stable.
Is this the same as synthetic monitoring?
No. Synthetic monitoring can tell you an endpoint is slow or failing. It often cannot tell you which hop, carrier, routing change, or dependency caused it. Internet path visibility helps explain the “why.”
Do I need to replace my current tools?
No. Most teams keep their current tools. WanAware adds visibility into the parts they cannot see today, especially across ISPs, carriers, routing, and third-party paths. Over time, some teams may consolidate tools, but WanAware is designed to complement what you already use.
If you are evaluating an observability platform, WanAware can serve as the observability layer that connects internal signals to external path and dependency reality.
Is the goal only to prove “it’s not us”?
Proving it is external is valuable, but the bigger win is speed and precision. When you can pinpoint where the degradation starts, you can escalate faster, route smarter, and reduce the time customers are impacted.