


The Never-Stop Factory: Keeping Automotive Production Moving in a Software-Powered Plant
The line slows. Dashboards stay green. Automotive downtime now costs ~$38K per minute — and most of it is spent on diagnosis, not repair. Here's how to fix that.

Downtime Is Now a Diagnosis Problem
In a modern automotive plant, the line can slow while every dashboard stays green. The war room fills up, teams restart systems, and minutes are lost on one question: where is the problem?
That is what downtime looks like now. More incidents start with slow networks, failed integrations, or hidden dependencies, not a broken conveyor. The line depends on many systems working together, including robots, PLCs, MES, and supplier sequencing. When one connection degrades, cycle time slips and throughput drops, even while each team’s dashboard still shows the systems are running.
The financial impact is immediate. Unplanned downtime in large automotive plants can cost millions per hour, and hundreds of millions annually.¹
This whitepaper explains why diagnosis takes longer in software-driven plants, why experience alone no longer carries teams through incidents, and how a shared view of assets and dependencies helps teams restore production faster.
The Cost Curve: Why the First Minutes Matter
The first minutes of a downtime incident cost more than most teams expect. In automotive plants, even brief slowdowns can lead to significant financial losses. A single hour of unplanned downtime can cost about $2.3 million, or more than $600 per second.¹ With average recovery times reaching 81 minutes, the typical triage-and-repair window can add up to millions in losses.¹
These costs are not driven only by lost output. They compound through:
- Missed take time, which causes work to back up at some stations and starve others
- Scrap and rework after sudden stops or quality drift
- Overtime and expedited logistics to recover volume
- Supplier penalties and dealer delays
The fastest way to reduce the total cost is to shorten the time it takes to pinpoint where the breakdown is. The sooner teams can identify where the breakdown lives, the sooner they can contain the impact and keep the rest running.
That is getting harder as plants grow more complex and deep experience becomes less available. As senior technicians retire, newer staff often have less historical context and must pull information from multiple tools under pressure.² ³
But even strong teams slow down when they do not share the same facts. The real delay is how long it takes to agree on what is actually in the workflow path and who owns the next step.
The Bottleneck Isn’t Talent. It’s Shared Facts
When production slows, plants still have capable people across reliability, controls, OT networking, and IT. What they often lack is a shared, trusted view of assets and dependencies.
Without shared facts, teams spend critical minutes coordinating, validating assumptions, and ruling out what did not cause the problem before they can fix what did. The delay is rarely the repair itself. It is the time spent finding the truth.
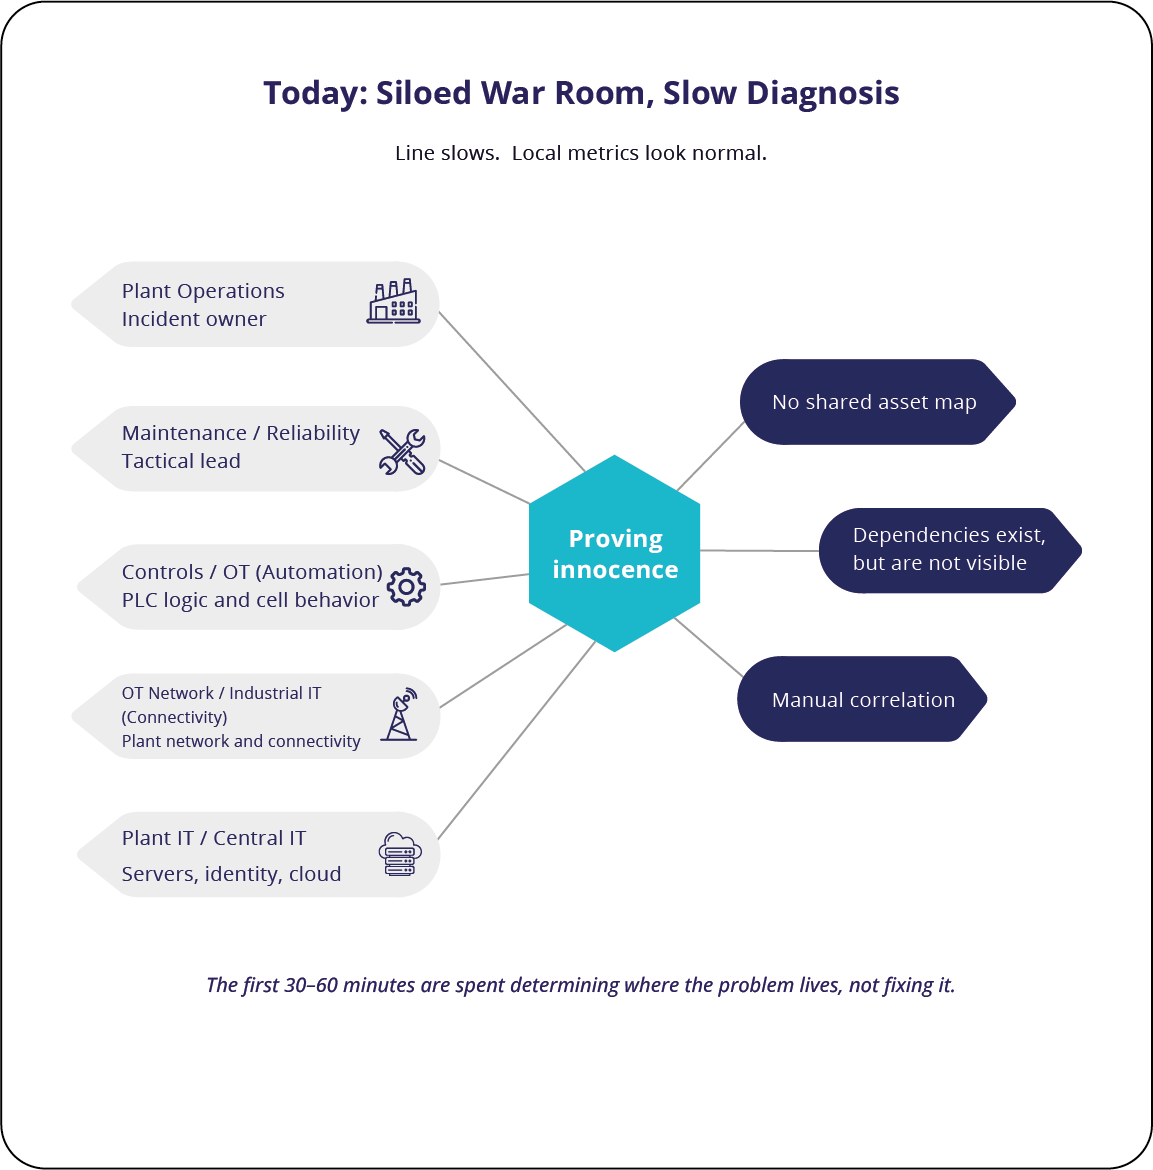
How the War Room Is Organized Today
When production slows, most plants spin up a war room to diagnose the issue and restore throughput. Roles are usually clear across five groups:
- Plant Operations: Makes the run/slow/stop decision and manages output risk
- Maintenance / Reliability: Checks equipment, restores function, and coordinates repairs
- Controls / OT (Automation): Validates PLC logic, robot behavior, and automation signals
- OT Network / Industrial IT: Supports connectivity between cells, lines, and plant IT
- Plant IT / Central IT: Supports servers, identity, and cloud integrations
What is often unclear is where the problem actually is when each team’s tools show “up” in isolation. The missing information is usually in the connections between systems, not inside one system. Many slowdowns happen in those links, where data, signals, and network traffic move from one domain to another. That might be a network route, a system-to-system handoff, or an outside dependency that no single group owns end-to-end.
In automotive plants, examples include supplier sequencing feeds, cloud-hosted quality services, or vendor remote access.
This is why war rooms lose time early: the hardest failures to spot are in the connections.
With shared context, teams can trace thedependency path behind the slowdown. Theycan see what connects to what, where theworkflow crosses systems, and where thebreakdown is most likely starting. That turnsdebate into clear next steps and brings in theright owner sooner.
External Connections: Often Missed, Often CostlySome of the most disruptive slowdowns come from connections outside theplant, like supplier sequencing, cloud-hosted quality services, and vendorremote access. When one of those connections starts lagging, localdashboards can still show systems are running even as the line slows. Sharedcontext makes those outside dependencies visible, so the war room can rulethem in or out quickly instead of guessing.
From Fragmented Data to a Live Dependency Map
Most automotive plants still rely on fragmented sources of truth:
- Spreadsheets for asset lists and ownership
- Static network diagrams that fall behind the floor
- PDFs for vendor documentation and cell specs
- Separate tools for IT, OT, and security that do not connect the dots
The problem is not only that documents get stale. The deeper problem is that plants change constantly. New systems are added, software is updated, and network paths shift, but the tools teams rely on do not keep relationships current. Without a live view of how systems depend on each other, visibility gaps happen by default.
What a Single Source of Truth Actually Means
A single source of truth is not another system of record. It is a live map of assets and relationships that stays current and can answer:
- What assets exist right now
- How they are connected
- Which services and workflows depend on which paths
That includes cross-domain paths, like a robot cell to MES, MES to a quality system, or sequencing signals tied to upstream supplier connections. With those answers, teams can rule things out fast and start in the right place.
A Live Map That Connects IT, OT, and Cloud Dependencies
With this view, teams can answer the questionsthat usually stall the first 30 minutes:▪ Is the slowdown tied to one cell, one linesegment, or an outside dependency?▪ Did a recent change create a new handoff inthe workflow?▪ Is the issue inside the plant network,upstream in IT, or outside the plant?Once those answers are clear, diagnosisbecomes path-tracing instead of debate.
From Symptom to Root Cause: Following the Dependency Path.
When the line slows, teams often spend the first stretch ruling things out instead of fixing the cause. A dependency view changes that by revealing the path behind the symptom.
In practice, teams can see the exact handoff that is failing, such as packet loss on an IT switch between the plant network and an external system. Instead of asking “whose fault is it,” the war room can say, “this link is failing, and this team owns it,” and move straight to action.
Once the failing link is clear, leaders still need one more answer: what else is at risk?
In the first 10–15 minutes of a slowdown, leaders usually have to decide:
- Slow the line or stop it
- Who to pull in now (controls, OT network, IT, vendor)
- Whether the issue is isolated or spreading to other systems
Blast Radius: What’s Affected and What’s Safe?
A blast-radius view separates what is impactednow, what is at risk next, and what is not in theworkflow path. That clarity prevents twocommon mistakes: stopping too much whenonly one area is affected, or missingdownstream risk until it becomes a line stop.Blast radius turns a slowdown into a cleardecision: act where it matters, and leave what issafe alone.
Once the blast radius is clear, teams respond with precise actions instead of overreacting. They avoid stopping unaffected systems “just in case” and spend less time debating scope. Operations, IT, and plant leadership share the same view of what must be fixed immediately, what should be watched closely, and what can keep running. That alignment turns a slowdown into a coordinated response instead of a plant-wide disruption.
From Visibility to Action: Responding Proportionally
Once the blast radius is defined, teams can move from discussion to execution. Instead of treating every alert as a full-line emergency, they direct attention where impact is real and time-sensitive. This keeps throughput moving while the underlying issue is addressed.
A proportional response follows three clear priorities:
- Fix what is broken first: Focus on systems already impacting throughput.
- Watch what is next: Monitor dependent systems before issues cascade.
- Keep the rest running: Avoid stopping operations that are not in the path.
Before blast radius
When production slows, teams often overreact. Without a clear view of dependencies, the safest option feels like stopping more than necessary. War rooms debate scope, pull data from multiple tools, and spend time ruling out causes. Escalations rise, unaffected systems are paused “just in case,” and recovery drags on.
After blast radius
When blast radius is visible, response is targeted. Teams know what is impacted now, what is at risk next, and what is outside the path. Ownership is clear. Actions are focused. Unaffected operations keep running while the real issue is fixed, reducing escalation and protecting throughput.
Why This Matters to Automotive Leaders
When the line slows, leaders have to decide fast: where the problem is, how far it extends, and what can keep running. Most teams are forced to make those calls with incomplete information. A shared dependency view reduces that uncertainty. It helps teams isolate the failing system sooner, limit the issue to the affected area, and avoid stopping parts of the operation that are not involved.
What WanAware Is and Is Not
WanAware gives plant teams one shared, up-to-date view of assets and how they depend on each other. In a war room, it helps teams see what is connected, what is affected, and where to start looking when the line slows.
WanAware is not:
- A replacement for MES, SCADA, or CMMS
- A full SIEM or a platform that runs and automates the plant
- WanAware does not run production. It helps teams quickly identify where the breakdown is and avoid unnecessary stoppages.
The Next Step
Find out where your war room loses time today.
In a short, self-guided assessment, you’ll map the dependencies and ownership gaps that slow diagnosis, then get a recommended starting point for a single-line pilot.
What you will receive:
- A snapshot of where diagnosis time is being lost
- The top dependencies and ownership gaps that slow response
- A recommended starting point for a focused, single-line pilot
Start the Diagnosis Assessment
Get the Single-Line Pilot Checklist
References:
1- Siemens Digital Industries Software. (2024). The True Cost of Downtime 2024. Siemens. Accessed December 29, 2025.
2- Brown, J., Ludwig, M., Kumar, A., Rees, S., & Schmieg, F. (2024, June 7). Converging IT and OT Will Boost Value in Industrial Tech. Boston Consulting Group. Accessed December 29, 2025.
3- The Service Council. (2025, January 10). 2024 Voice of the Field Service Engineer: The Trend, The Surprise, and the Red Flag. The Service Council. Accessed December 29, 2025.
4- McKinsey & Company. (2023, December 4). Need to Boost Semiconductor Fab Efficiency? Look to Maintenance. McKinsey & Company. Accessed December 29, 2025.
5- World Economic Forum. (2025, September 16). 3 Lessons from the Global Lighthouse Network: Why It Matters. World Economic Forum. Accessed December 29, 2025.