


IT Asset Visibility: Why Asset Relationships Matter More Than Ever for 2026
Asset dependency mapping shows how incidents spread — not just what exists. Learn why asset relationships reduce blast radius and speed recovery in 2026.

When a critical system goes down, the clock starts on downtime, performance, and security risk.
How fast you recover has less to do with how many tools you own and more to do with whether you can see how your assets actually connect.
Today, teams are being asked to troubleshoot with tools that lack both entire classes of assets and almost all Asset Relationships between them. It is like planning a road trip with a map that shows half the cities and none of the roads. You know a few destinations, but you cannot see how to get between them or what happens when a major route is blocked.
Most asset inventories do not give you the picture you need during an incident. They are incomplete, and they do not show dependencies. A better approach to IT asset visibility in 2026 focuses on complete coverage of assets, clear asset relationships, and the ability to act with confidence when something breaks.
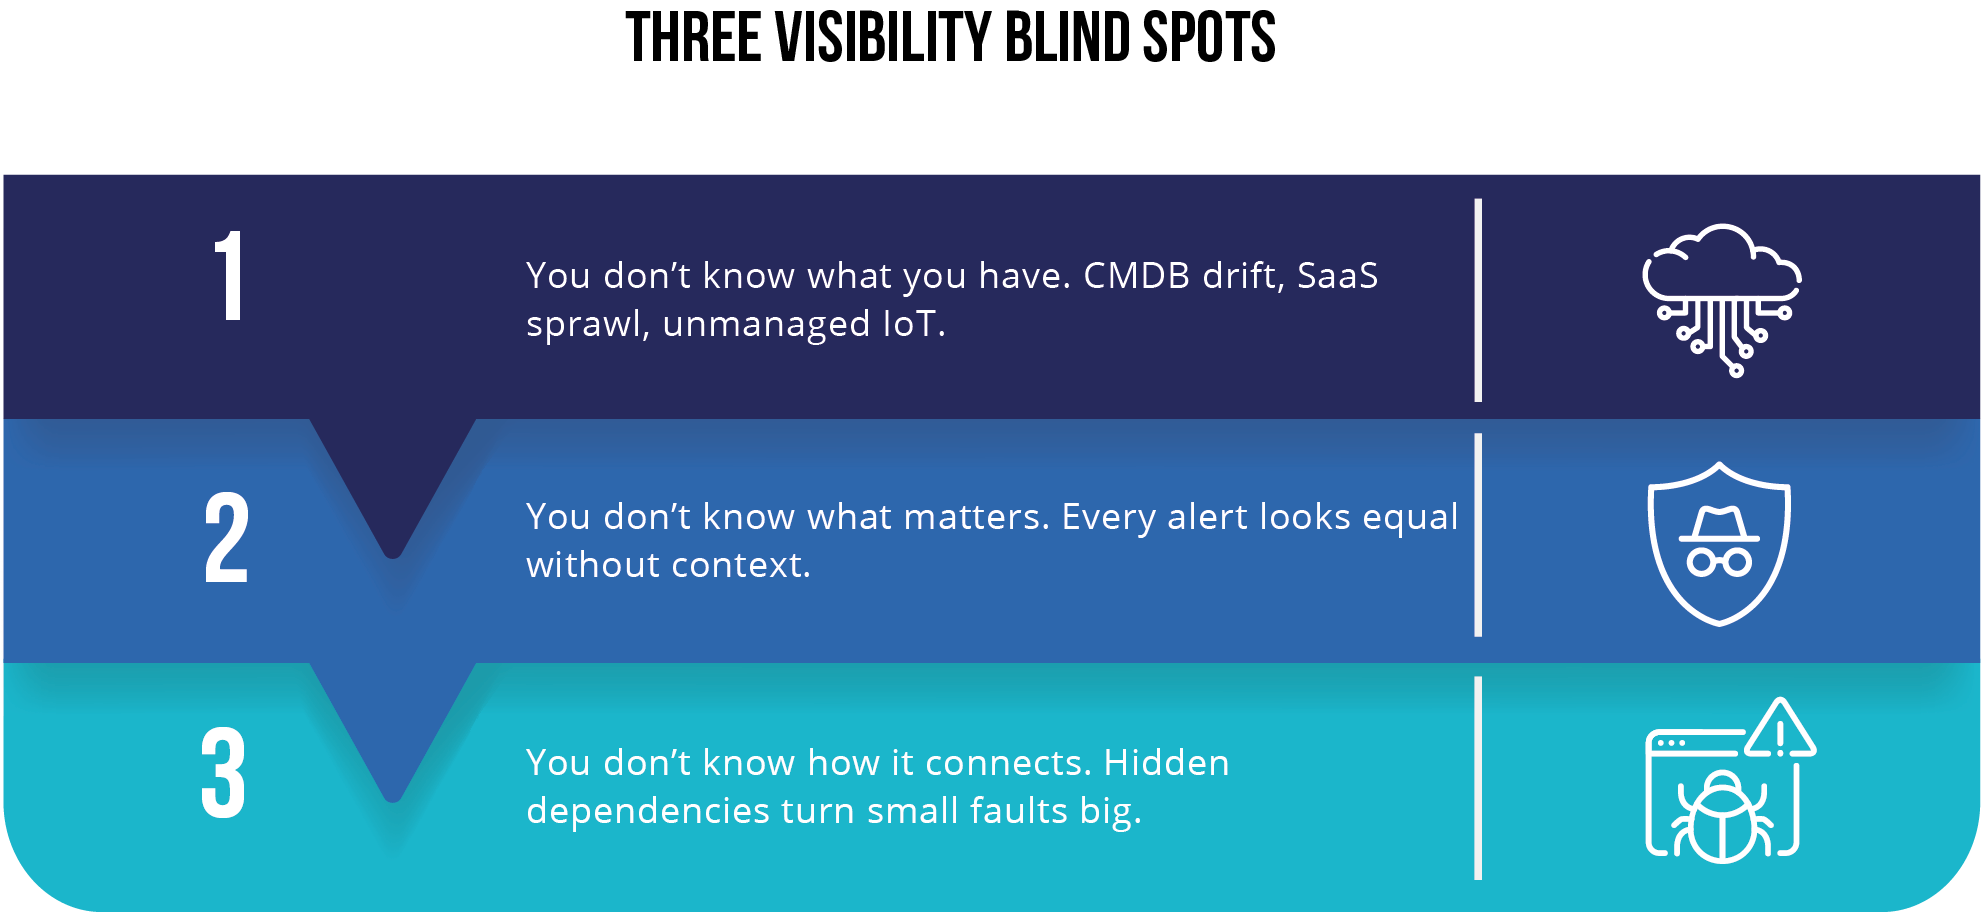
Why IT asset visibility without context fails IT teams
When something breaks, the first job is to understand what failed, what it touched, and how far the impact spreads.
Most teams try to answer these questions without full IT asset visibility across their environment. They may see some assets, but they rarely see how those assets depend on each other. That is where incidents actually unfold.
Many environments have a long list of tools. One handles logs, another handles metrics, another handles traces, and a fourth handles alerts. Each tool shows a different slice of reality, and none of them shows how the slices fit together. That is why incident calls drag on. Teams are comparing partial views rather than working from a single shared map.
Even the best-maintained asset lists fall short here. They may help you confirm that something exists, but they do not tell you:
- Which services or business functions rely on it
- What traffic paths move through it
- What else will fail if this asset degrades
- Where an issue is likely to travel next
In complex and distributed systems, risk and outages move along asset relationships, not individual nodes. A flat list, even a complete one, cannot show the parts that matter most when the pressure is on.
A new model for true IT asset visibility
Since the old way creates blind spots, teams need an asset visibility model that keeps pace with how systems work today.
Modern environments change constantly. New cloud instances appear, containers cycle, network paths shift, and third-party services play a larger role in core workflows. A static inventory cannot keep up with that pace or show how issues move across connected systems.
A better approach starts with three basic questions:
- Can you see all the assets that matter?
- Do you understand how those assets depend on each other through asset relationships?
- Can you act with confidence when something breaks?
True IT asset visibility grows in stages. First you uncover the assets you did not know about. Then you add context to see how those assets fit together. Finally, you connect that information to the actions your team needs to take during incidents or planned changes.
When these three parts work together, teams spend less time guessing and more time solving the real problem at hand.
IT asset visibility maturity model
Not every team starts from the same place. Some are still tracking assets in spreadsheets. Others have invested in multiple tools but still struggle during incidents. A simple way to think about IT asset visibility is in four stages.
- Static lists
Assets live in spreadsheets or basic databases. Updates are manual and easy to miss. Coverage is patchy, and no one fully trusts the data. - Tool sprawl
The team has several inventory and monitoring tools. Coverage improves, but each tool has its own view, and the data is still fragmented. - Unified inventory
In this stage, most assets roll into a central inventory. The list is more complete, and teams can search and filter in one place. Yes, asset relationships and live behavior are still hard to see.
Relationship-aware visibility
Assets are discovered continuously and linked to each other. Teams can see what depends on what, how those paths behave, and which nodes matter most when something changes.

The goal for 2026 is not just a larger inventory. It is to move closer to the fourth stage, where teams see both the assets and the relationships among them that shape risk, performance, and reliability.
The three stages in practice
Most teams move through visibility in three practical steps. Each step builds on the one before it and removes a different source of confusion during incidents.
1) See everything
You cannot understand or protect what you cannot see. Continuous discovery brings every server, container, endpoint, cloud resource, and connected device into view as soon as it appears. This removes the unknown and unmanaged assets that create the biggest surprises during outages and security investigations.
2) Understand what matters
A list of assets is only the starting point. Teams need to understand how those assets depend on each other through clear asset relationships. This includes application paths, data flows, shared services, network links, and third-party connections. When those relationships are visible, you can trace how a small issue moves through the environment and which nodes have the most impact on uptime and safety.
3) Act with confidence
Once you can see the full estate and understand the dependencies, the next step is to connect that insight to action. Teams can prioritize fixes based on impact, not guesswork. They can automate safe, repeatable tasks, shorten response times, and reduce the risk of self-inflicted outages (when your fix ends up causing more damage).
When these three stages work together, IT asset visibility becomes a practical tool for faster recovery and safer operations. It gives every team a shared understanding of what is happening and what matters most in the moment.
How WanAware maps to IT asset visibility and asset relationships
The visibility model becomes useful when it connects to real capabilities. WanAware is built to help teams move from scattered and incomplete views to relationship-aware IT asset visibility across IT, OT, and cloud environments.
See everything with continuous discovery
WanAware Asset Inventory Management (AIM) performs continuous and agentless discovery across your estate. It finds servers, cloud instances, containers, endpoints, OT devices, and short-lived assets that do not always appear in traditional inventories. This turns unknown assets into known ones and provides a single place to see what exists.
Within AIM, the Asset Inventory view gathers the core record for each asset. It shows details such as asset type, environment, location, owning team, business function, criticality, and last seen time. This gives teams a reliable starting point for any investigation.
Understand what matters with context and asset relationships
The Asset Inventory view provides the core record for each asset. The Knowledge Discovery Engine adds richer context such as ownership, business role, related systems, and links to runbooks or documentation.
The Connected Assets view then links everything together. It shows how applications, services, data stores, networks, and third parties depend on each other through asset relationships. The digital twin uses that same map to simulate changes and highlight the paths that matter most before any action is taken.
Act with confidence through informed decisions
When an issue appears, Actionable Observability attaches logs, metrics, and events to the assets and relationships involved. This gives teams a clear picture of current behavior, not just a static record.
The remediation layer then helps them carry out targeted actions such as patching, rotating credentials, or adjusting configurations. Each action is guided by the asset relationships and impact paths that are visible in the system.
These parts work together to give teams the information they need to recover faster, reduce risk, and make better decisions during incidents and planned changes.

Relationship-aware IT asset visibility in the real world
A list of assets can show what exists, but it cannot show how issues spread or where the real risks sit. asset relationships fill that gap. When teams can see how assets depend on each other, they can understand impact paths, spot weak points, and focus on the areas that create the most risk during an outage or security event.
This pattern appears across every industry.
In healthcare, unseen connections between medical devices and clinical systems can delay care.
In energy and utilities, one incorrect setting on a field device can move through shared systems and cause a wider interruption.
In financial services, missing cloud assets and unclear data paths create audit findings and outage risk.
In telecom, automotive, and aviation, distributed systems make it easy for a small fault to ripple across regions and customer segments.
Relationship-aware IT asset visibility gives every team a shared map of the environment. It shows which paths matter most, which systems carry the highest risk if something changes, and where teams should focus when the pressure is on.
Blast radius and why asset relationships matter
When assets are linked together, a problem in one place rarely stays there. It moves along the paths between systems. That spread is the issue's blast radius. During an outage or security event, teams need to see not only what failed, but also what is likely to be pulled down with it.
Traditional asset inventories cannot show blast radius. They list assets, but they do not capture the paths between them. As a result, teams have to guess which applications, services, and data stores are at risk when something changes.
Relationship-aware IT asset visibility closes that gap. When you can see how assets depend on each other through asset relationships, you can trace how an issue moves through the environment and which nodes carry the most impact. In WanAware, the Connected Assets view and digital twin use these relationships to make blast radius visible and easier to reason about before and during an incident.
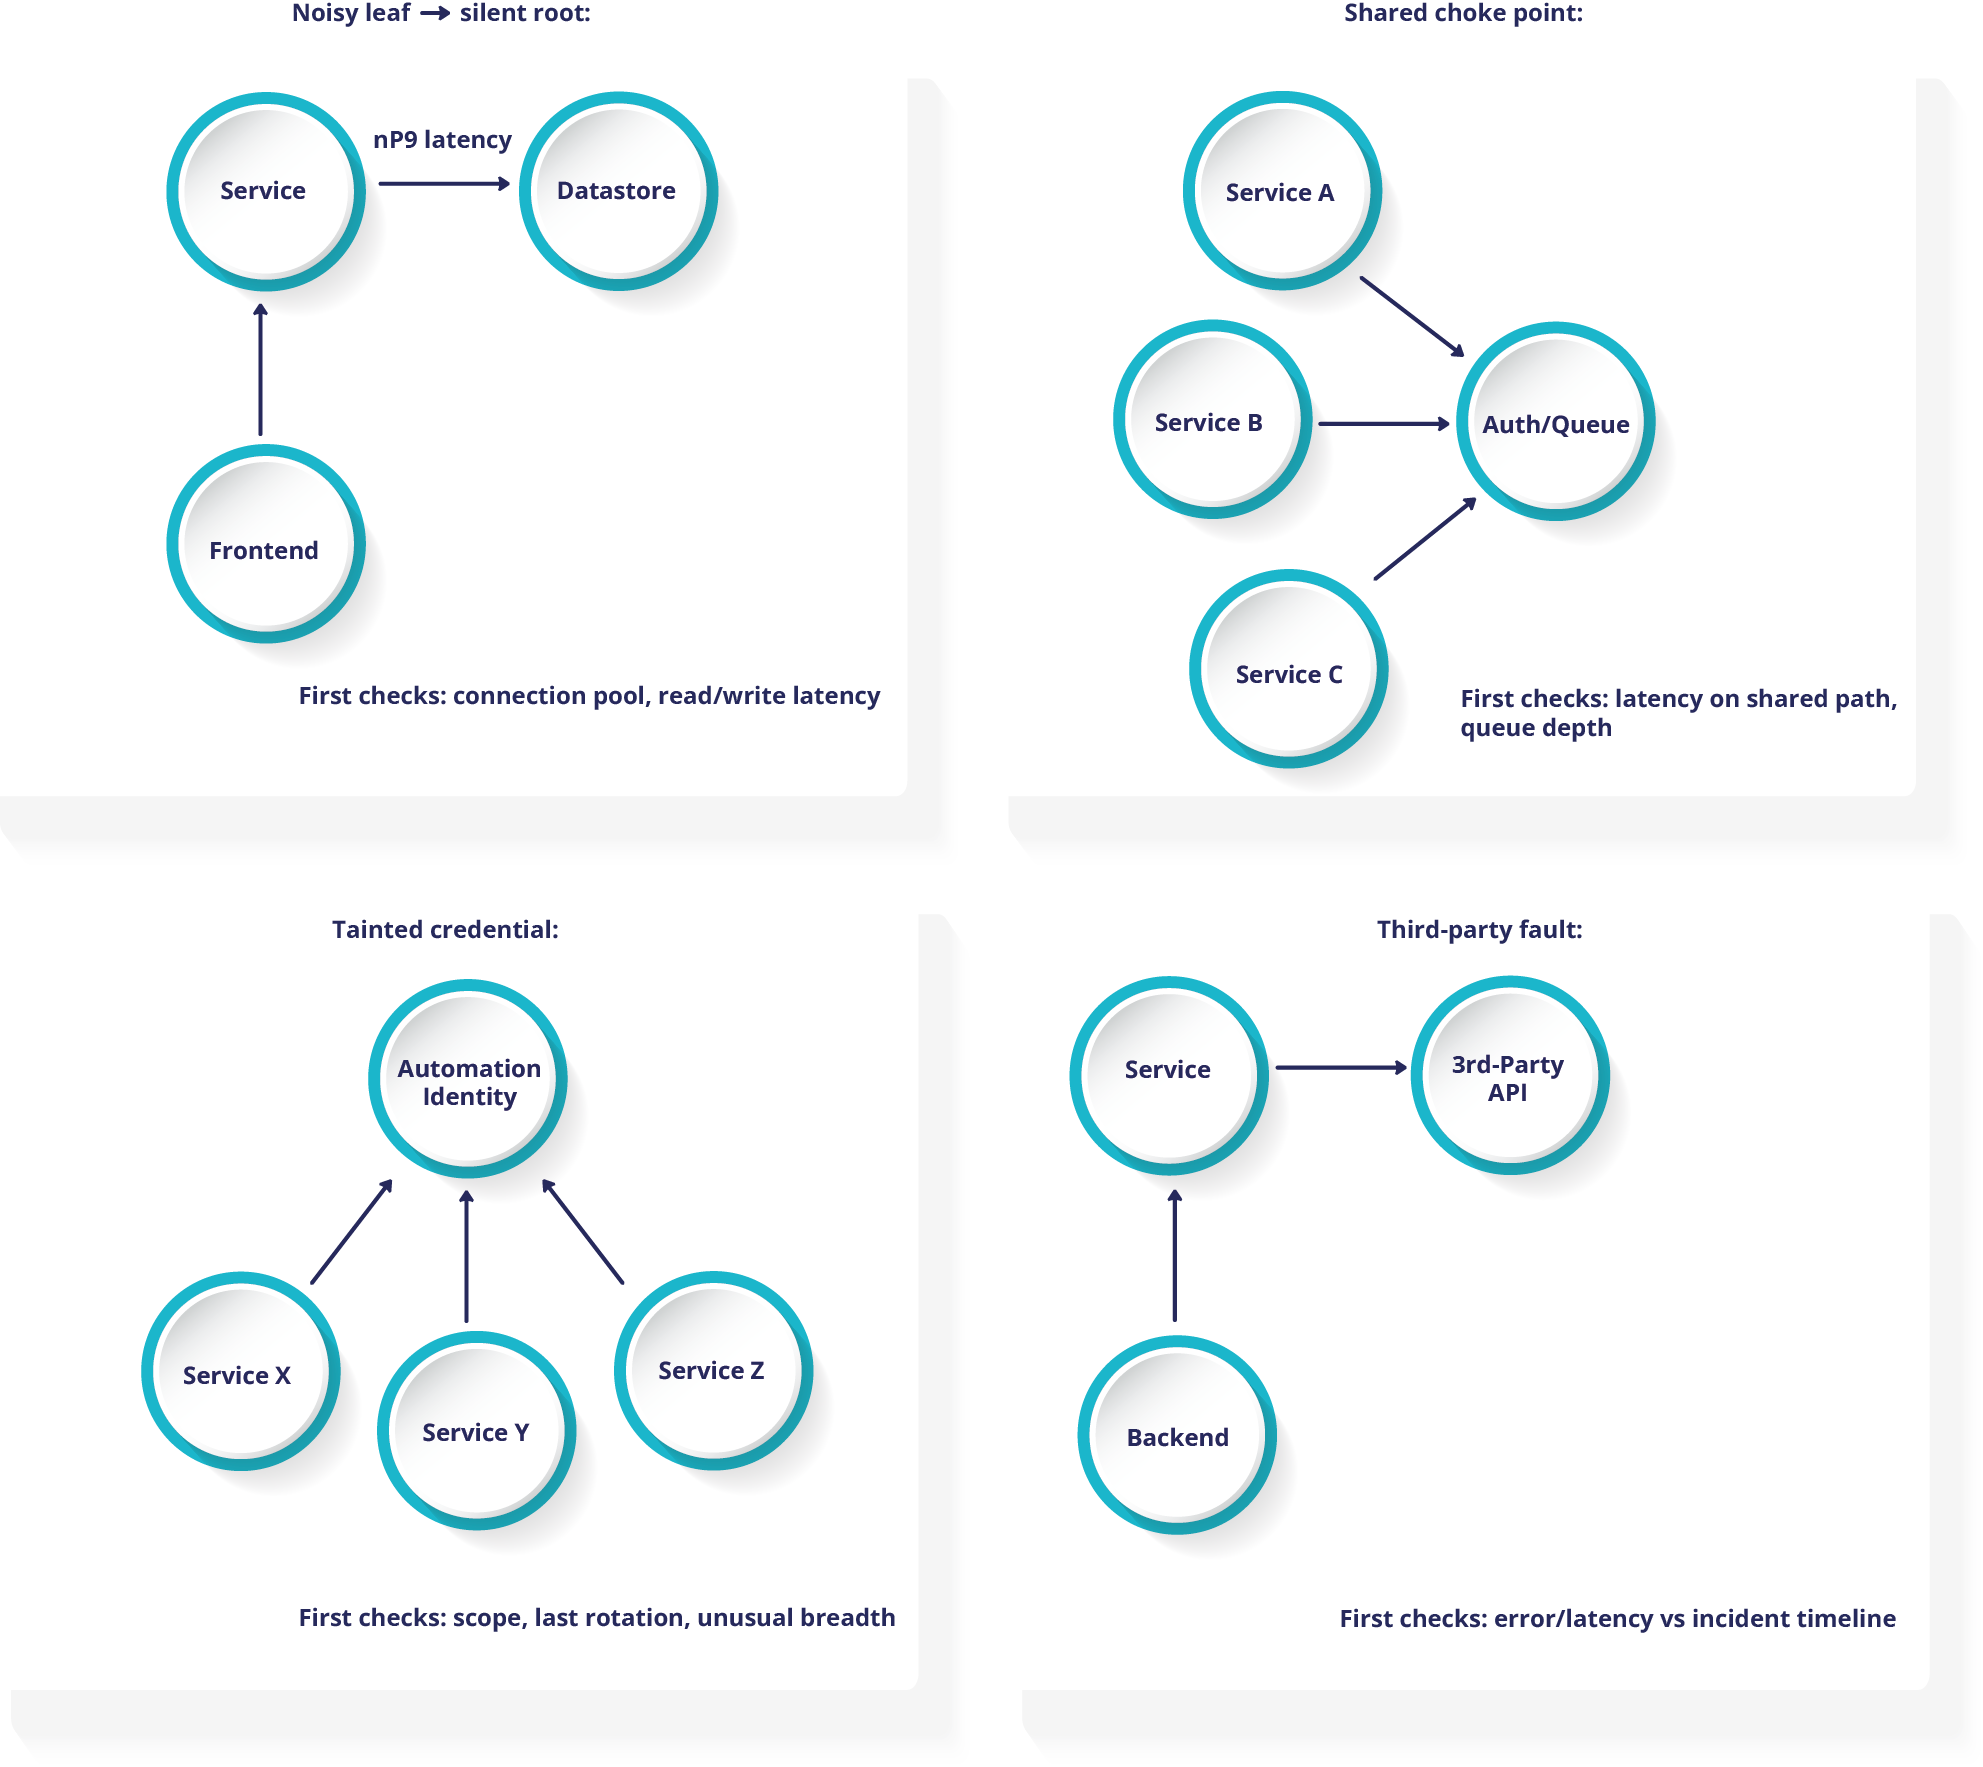
Four patterns that show up in every environment
Once relationships are mapped, familiar patterns of spread start to appear. These patterns show up in almost every complex environment, regardless of industry.
1) Noisy edge, silent root
Symptoms
A front end or service throws intermittent errors. The underlying data store appears healthy at a quick glance.
First check
Trace calls from the service to the data store on the relationship map. Look at read and write latency, connection pools, and timeouts.
High value fixes
Right size connection pools. Add back pressure where needed. Cache hot reads. Set clear objectives for acceptable latency at the data store layer.
2) Shared choke point
Symptoms
Several applications slow down at the same time, without a shared code change or deployment.
First check
Look for a shared dependency that sits in the middle, such as an authentication service, message queue, or API gateway. Check its latency and error rates against the incident timeline.
High value fixes
Rate limit non critical calls. Increase capacity on the shared path. Add circuit breakers so failures in one area do not pull down everything that relies on the same service.
3) Tainted or over scoped credential
Symptoms
Multiple systems show unusual changes or access within a short period of time.
First check
Trace actions from automation accounts or service identities. Confirm their scope, age, and last rotation date.
High value fixes
Rotate the credential. Reduce permissions to the minimum required for normal work. Use just in time access for sensitive paths where possible.
4) Third party fault
Symptoms
Your application slows down, but internal services and infrastructure appear healthy.
First check
Map calls to external providers and APIs. Compare their latency and error patterns to your incident window.
High value fixes
Add timeouts and sensible fallbacks. Cache results that can be slightly stale. Where it makes sense, split traffic across more than one provider so a single failure does not affect all users.
Where to start with IT asset visibility in 2026
Real IT asset visibility is not a nice-to-have. Cloud growth, SaaS adoption, remote work, and tighter regulations all raise the cost of blind spots. The teams that move ahead in 2026 will be the ones that can see every asset that matters, understand asset relationships, and act with confidence when something breaks.
You do not need to rebuild everything at once. A practical first step is to focus on one critical business service or application. Turn on continuous discovery for that area. Use the relationship map to understand which systems and providers it depends on. Look for the blast radius patterns you already recognize from past incidents.
Next, connect a small set of high-value actions to that context. For example, patch the node that sits on the most paths, tighten access on the most connected credential, or add fallbacks for a fragile third-party dependency. Once this is working in one area, extend the same approach to other services and teams.
Over time, you move from scattered lists and tool-specific views to a living, relationship-aware picture of your environment. That picture is what lets you troubleshoot faster, reduce risk, and support the systems that matter most to your business.
Frequently asked questions about IT asset visibility and Asset Relationships
If you are starting to rethink IT asset visibility, a few questions come up first.
Q1. What is IT asset visibility?
IT asset visibility means knowing what exists across cloud, data centers, endpoints, OT, and SaaS, along with how those assets are configured, who owns them, and how they are behaving. It is the foundation for security, performance, and availability work.
Q2. Why do Asset Relationships matter?
Incidents and risks rarely begin and end on one system. They move along the paths between applications, services, data stores, networks, and third parties. asset relationships make those paths visible so you can predict blast radius, prioritize fixes, and avoid surprises.
Q3. What is the difference between an inventory, a CMDB, and continuous discovery?
A static inventory or CMDB records assets at a point in time and often relies on manual updates. Continuous discovery finds new and changing assets as they appear, including short lived cloud resources and remote systems. It keeps records current without constant human effort.
Q4. What is dependency or relationship mapping?
Dependency mapping is a live view that connects applications, services, data stores, networks, devices, and external providers. When one node fails or changes, you can see who and what is affected.
Q5. How does this improve security and performance?
When alerts and vulnerabilities are tied to asset relationships, teams can see which issues sit on critical paths and which are less urgent. This speeds root cause analysis, reduces noise, and makes planned changes safer because teams can see impact before they act.
Q6. Where does a digital twin fit?
A digital twin is a safe place to test changes and failure scenarios. It uses the same relationship map as production, but lets you experiment without risk. This reduces self inflicted outages and helps teams feel more confident about major changes.
Q7. Who should own this work?
Security, operations, and engineering all have a stake in IT asset visibility. In practice, it helps to name a clear owner for each stage: seeing assets, understanding asset relationships, and acting on what you find. A short weekly review with these groups keeps the model aligned with reality.
Explore Similar Content

Explore Similar Content